Text-to-chart
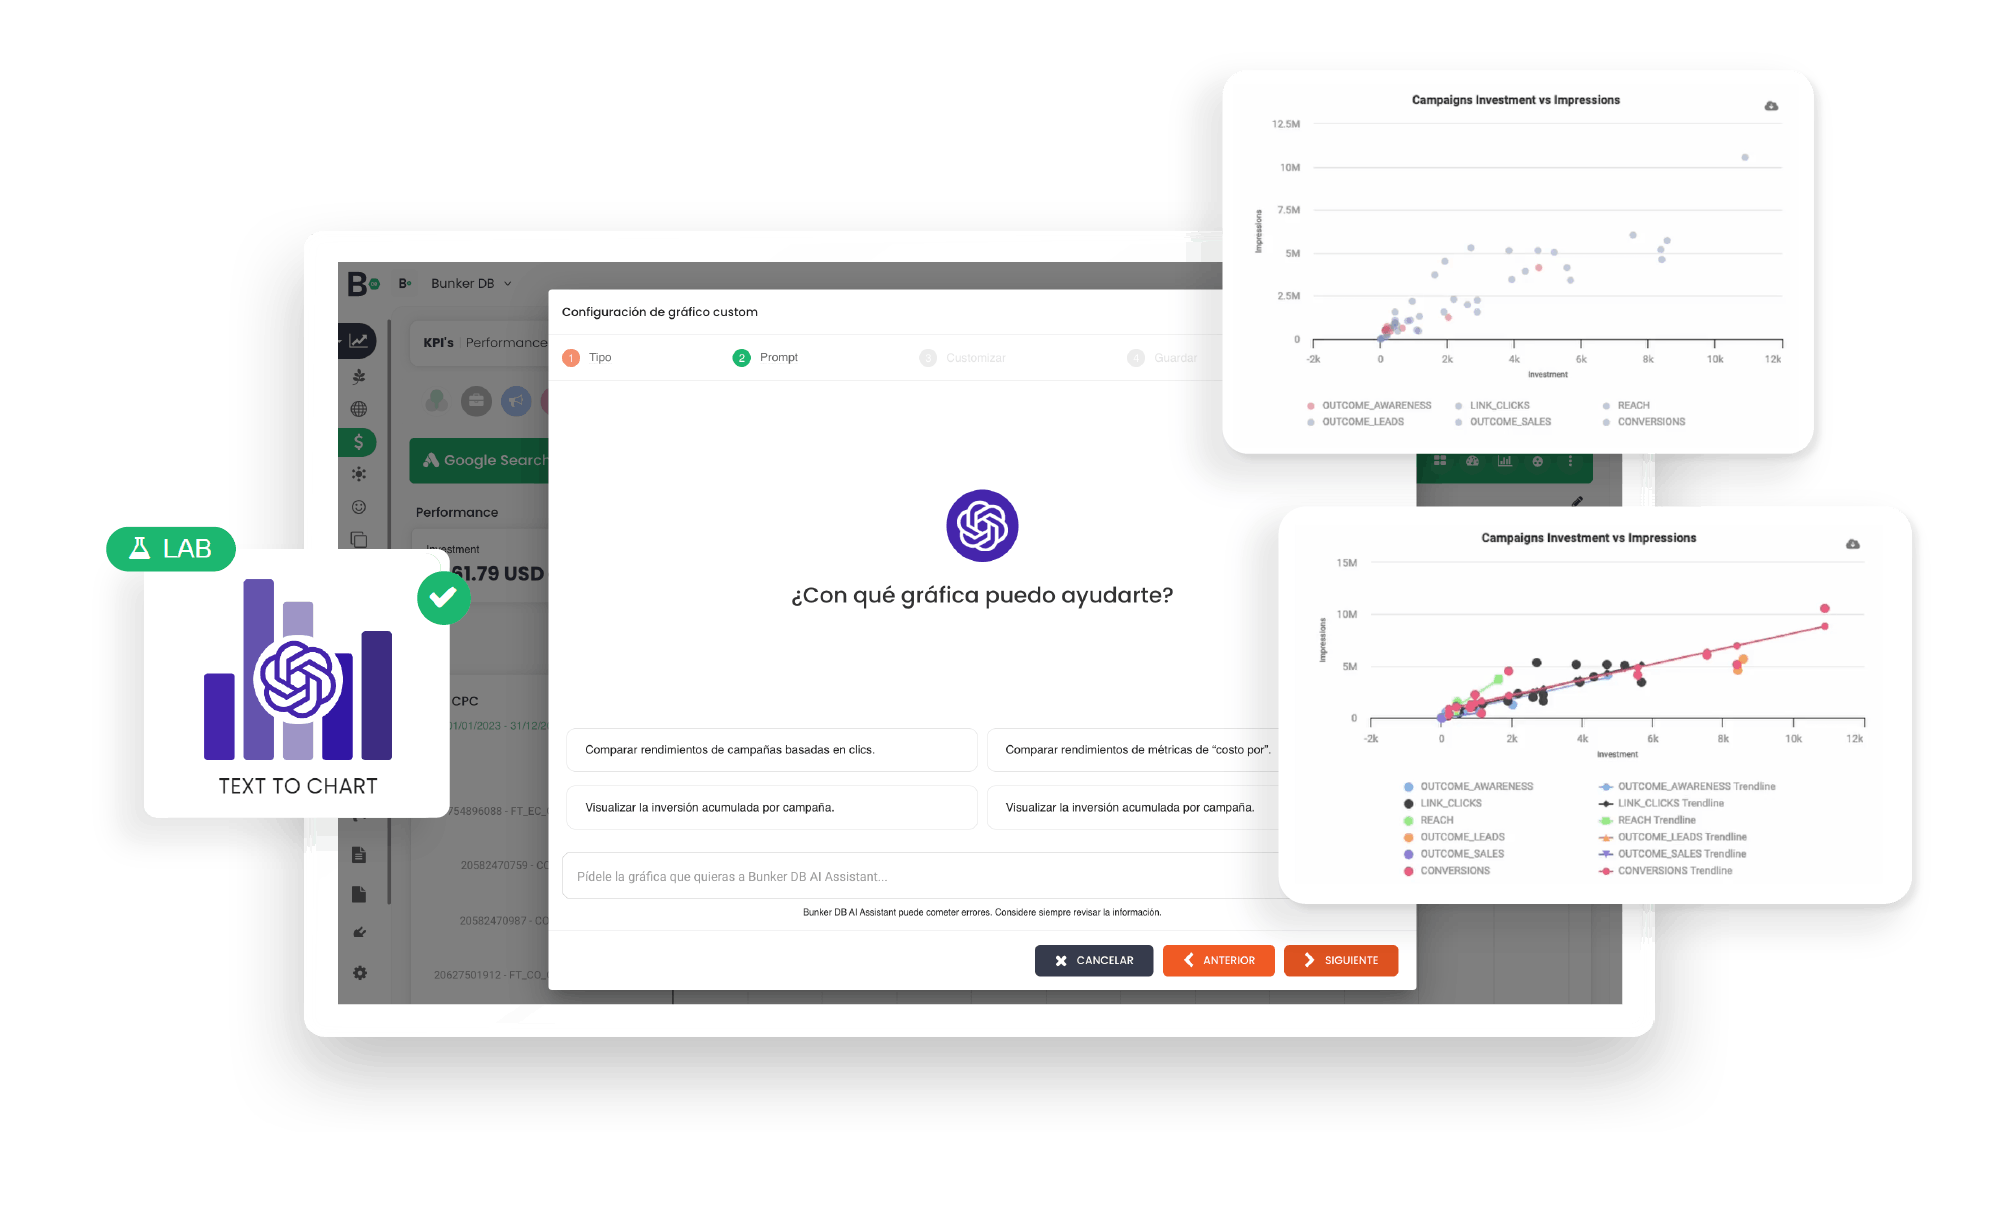
From question to chart in seconds. Turn plain text into automated visualizations with AI. Text-to-chart interprets your questions and generates accurate charts that integrate directly into your dashboards—no coding or manual setup required.
REQUEST A DEMO
From question to chart in seconds

Why use Text-to-chart?
Natural language questions, instant visual answers
Forget about memorizing menus or navigating through complex filters. With Text-to-chart, you simply type your question as if you were having a conversation: “How did Instagram reach evolve last month?” or “Compare CTR between Google Ads and Meta in the last quarter.” The AI interprets your query and automatically generates the chart that best represents that information.
AI-generated, fully editable charts
The system selects the most suitable visualization type (line charts, bar graphs, tables, heat maps, etc.), but allows you to adjust colors, axes, titles, and styles to match your preferences or brand guidelines. This way, you combine fast creation with complete editing flexibility.
Native integration with Dashboards 360°
Every chart you generate can be added directly to your personalized Bunker DB dashboards. This means no exporting or re-uploading data—everything stays in one ecosystem, ready to share with your team or present to clients.
Compatible with multiple data sources
Ask questions and generate charts using information from different Bunker DB modules, such as Paid Media, Social Media, Leads, or Owned Media, all in a single query. This enables you to cross-analyze channels and campaigns for more complete, strategic insights.
Our unique value
Text-to-chart turns questions into visuals with one sentence. It’s built for professionals who want clarity, agility, and autonomy when analyzing performance. It’s not just a charting tool—it’s AI that speaks your language and empowers your decision-making.
Discover other modules included in Analytics
Other
solutions
by PRODUCTS AND SERVICES


